So you want to be the next RX Bar?
Consider being the next Satori Spins. A dive into the world of data syndication as a consumer packaged goods brand.
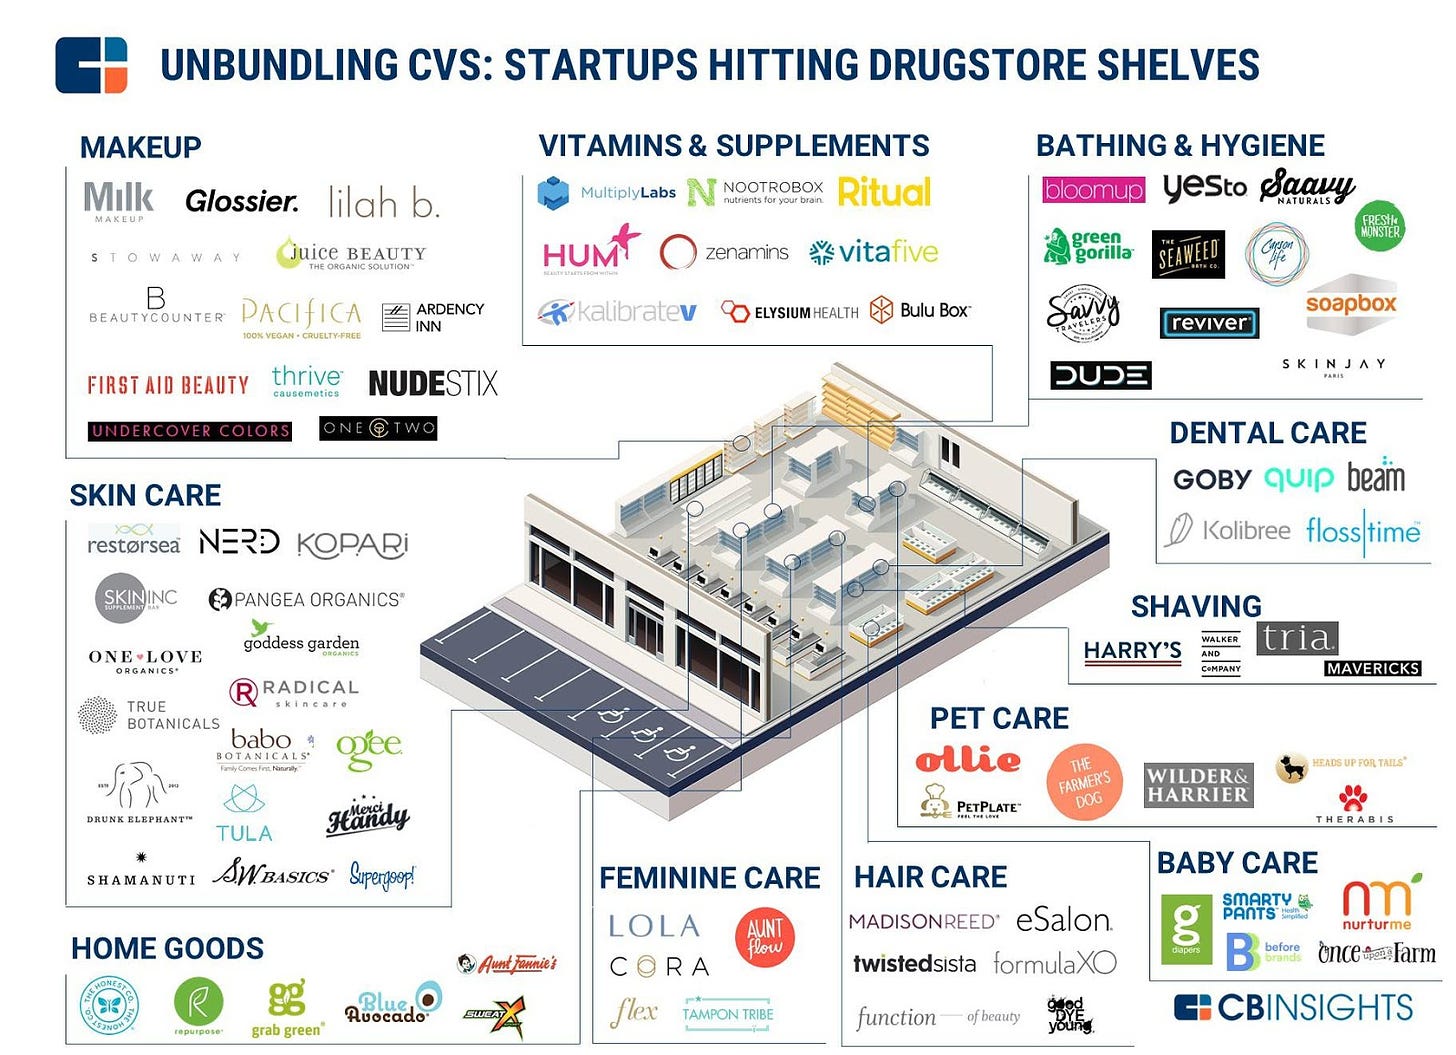
I’m going to take a risk today to get into an industry that’s outside my comfort zone- Consumer Packaged Goods (CPG). CPG is a hot space. Thanks to companies like Shopify, the opportunity to launch an MVP (minimum viable product) CPG company with a digital distribution channel is the easiest it’s ever been. As a result, there are an average of 30,000 new CPG products launched each year (and growing).
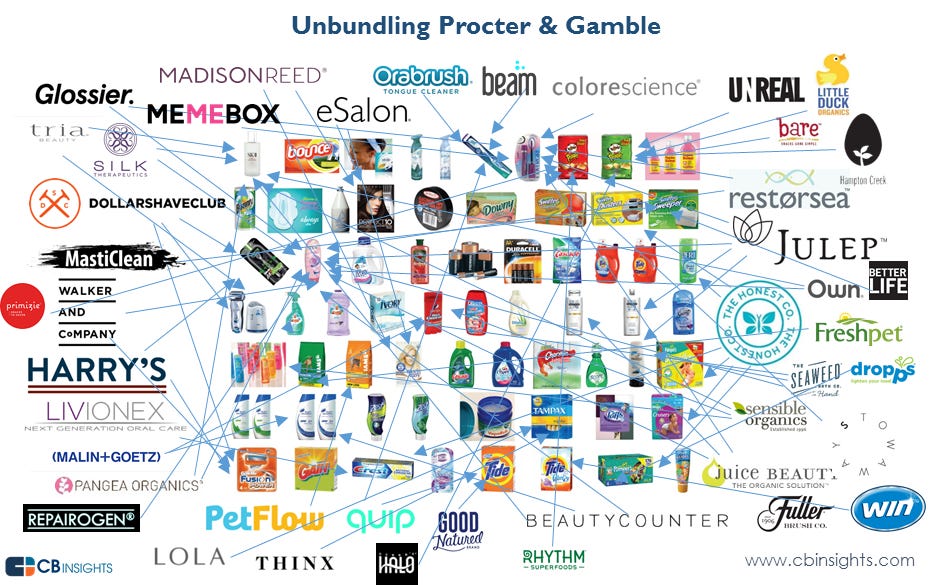
At the same time, from a top level, it is becoming more and more common for the major brands in CPG (i.e. Mars, General Mills, Proctor & Gamble, etc) to acquire smaller players into their portfolios. For the top ten large-company growth leaders in 2018, roughly 40% of their growth came from brands they'd acquired over the previous five years. On top of that, according to SDR Ventures, of 99 M&A transactions in CPG during the first half of 2020, the median deal multiple was 9.1x EBITDA. What I am saying is- lots of new CPG brands due to lots of potential revenue upside. One of the major acquisitions that shed light on this new trend was when Kellogg acquired Rxbar in 2017 for $600 million.
With that said, the game of competing for shelf space kinda sucks. And your margins can get really obliterated with the most popular retailers (Whole Foods, etc).
What’s interesting about the space?
So why should you care about this. While a lot of really cool CPG brands these days are launching D2C on e-commerce, to really hit the money maker you need to be in big box retail. And, that’s no easy feat given the stiff competition. If you haven’t noticed, your local Whole Foods is now carrying probably ten different types of alternative beef jerky (Hello, Moku).
To expand your footprint in big box retail and make smart decisions you need to have data insight. Thus, the most challenging part of having a CPG brand is actually the data syndication. If you are Dr. Praegers selling Veggie Burgers. You are probably selling in Walmart, Whole Foods, maybe even CVS and online with Amazon. To understand your sales on each of these channels, you are going to have to pay each retailer for a monthly report. This is costly and not effective in quick decision making. Plus the formatting will probably require an inhouse data scientist to synthesize. (Sidenote: IMO there is an opportunity for a new brick and mortar retailer that is brand friendly and digitally forward i.e. in store robotic automation, digital shelving, free data analysis, etc)
As a result, you must use a syndication platform in order to understand what your sales are like through each retailer as well as understand how your competitors are doing.
So, I am here to talk about these data syndication platforms. To date, there are really only a few companies running the data syndication show right now- Satori Spins, Nielsen and IRI.
How are these used?
Nielsen’s wiki page actually provides a really comprehensive explanation of what all of these platforms ultimately do (and some minor details on their customer base):
It is Nielsen’s data that measures how much Diet Coke vs. Diet Pepsi is sold in stores, or how much Crest versus Colgate Toothpaste is sold. Nielsen accomplishes this by purchasing and analyzing huge amounts of retail data that measures what is being sold in the store, and then combines it with household panel data that captures everything that is brought into the home. These measures of sales performance also fuel a range of forward-looking analytics to help clients improve the precision and efficiency of their advertising spending, maximize the impact of their promotion budgets and optimize their product assortment. They also can provide insights into how changes in product offerings, pricing or marketing would change sales. Major clients include The Coca-Cola Company, Nestle, The Proctor & Gamble Company, Unilever Group and Walmart.
As a brand, you are going to want to see this data for a few reasons. Let’s hash out some examples.
Understanding sales patterns and seasonality: See how you are doing in certain stores. Analyze which pricing structures work best (which deals leads to greatest revenues). Look for out of stock indicators in sales data- if there is a pattern of steady sales followed by a steep drop off, this is a good indication that you were out of your product.
Rolling out new product offerings: Attribution tagging allows brands to consider new areas (gluten free, vegan, etc) by studying competitor tags and sales comparisons.
Product placement: Showing the effect of product placement on through sales. So much of revenue is dependent on where on the shelf the product lives. You can directly track how this affects revenue.
Competitive analysis: Understanding your product category’s growth trajectory and competitor sales can also lead to easier investor conversations, competitor revenue can back up market share opportunity.
Building a sales case externally: Most retailers will test out a brand in a certain geo before launching nationwide. Brands can build cases for quickened roll outs by analyzing their competitors sales numbers in specific areas.
As you might imagine, on the other end of the spectrum, companies like Proctor & Gamble are using Nielsens not only to analyze how their current products are selling but also to watch potential acquisition opportunities.
Similarly, these platforms not only benefit brands, large and small, but also benefit investors looking at potential investments. CPG focused venture firms like CircleUp can use platforms like Nielsens in tandem with Second Measure (recently acquired by Bloomberg) in order to build a cohesive thesis on certain CPG spades.
History of the Trio
I honestly could not find a lot of background of Spins. It sounds like they have ridden the natural foods trend being founded in 1997.
Nielsen, on the other hand, has a vast history. It was founded in 1923 by Arthur Nielsen based on the idea of selling engineering performance surveys aka market research. They expanded to retail in 1932. My favorite part is that in the 80’s, they launched a new measurement device known as the “people meter”. This was essentially a remote control with buttons for each individual family member (and guests). Viewers were to push a button to signify when they are in the room and push it again to signal when they leave. This was the first form of viewer measurement intended to paint a more accurate picture for news stations of who was watching and when. Boy, have we come a long way. As has Nielsen. They are now present in more than 100 countries, collecting sales data from over 900k stores worldwide and they are publicly traded on the S&P. Their “Buy” segment of their business, as they call it, or retail data syndication and measurement is responsible for 45% of their revenue, the rest of their revenue is generated through TV and media measurement.
Meanwhile, IRI was founded in 1979 by John Malec and Gerald Eskin who started by purchasing scanners for supermarkets in order to gather PoS data from barcodes in grocery stores. IRI went public in 1983 but is no longer listed.
Why did I even get into this? The main point is, these companies are really, really old. There is not a ton of innovation happening and it is crystal clear when using the platform.
How to choose between current offerings?
Back to the main event, how do brands decide which data syndicator to use? The major difference lies in the types of stores they are looking to sell in. IRI and Nielsen cover a very broad swath of product categories- food, drug, mass, convenience and dollar. After nearly a century in business, Nielsen has cultivated many valuable exclusive deals with major retailers, each with their own national footprint of retail locations such as Whole Foods, Smart & Final, Byerlys/Lunds, Kinney Drugs, Dollar General and Petsmart.
Meanwhile, despite maintaining only a fraction of the employee headcount, IRI has managed to cultivate a strategic appeal with exclusive access to Costo, Kroger family brands and H-E-B.
Whereas Spins, hits the smaller niche of natural grocery and specialty gourmet maintaining an exclusive data partnership with 18 natural supermarkets including key players like Sprouts, Fresh Market, and The Vitamin Shoppe.
At the end of the day, some retailers are very limiting in the amount of sales data they provide, if any, to any of these platforms instead requiring you to get data directly from them in one off reports (a revenue stream for them and a very annoying hindrance for the brand). So Spins will give the brand a comprehensive view of the natural sales channels, if you are selling mainly through Whole Foods you would need to supplement the Spins market data with Whole Foods direct data, ugh. Whole Foods isn’t the only pain in the butt here. Trader Joe’s, Costo and Aldi are a few of a handful of other retailers that limit the use of their sales data.
Overall, sounds like as a major international brand, you are probably just going to have to use all of them, right? Which kind of defeats the point since these platforms are supposed to be aggregator tools. Do I need an aggregator for these three aggregators? Weird..
Elephant in the room- Amazon
So what about digital sales? How are those accounted for in the mix? Well, last year, Nielsen announced a strategic move into e-commerce and wellness by expanding its Connect Partner Network with Amazon’s leading automation and insights company CommerceIQ and Spins. After seeing growth in the digital and health -conscious space, Nielsen decided to stay ahead of the curve by integrating with two partners that are at the forefront of these trends. So it’s a positive to see these guys working together.
How tied to POS systems is this?
Back to the shelf. The answer is very. The challenge at hand is that all of these retailers have essentially built their own POS systems for their own needs.
For example, Walmart’s POS system is completely custom-built. The tech team behind the point of sale system didn’t start from nothing, though. In fact, they used the SUSE Linux Enterprise Point of Service (SLEPOS) as their starting point. Likewise, tech giant Best Buy has looked to E3 Retail for its POS solution needs. Whereas, Target utilizes its own in-house POS system, which has been developed by its IT department, Target Technology Services. Unlike small business, large retailers are not relying on Square as the POS system. If they were, data aggregation and analysis could be a platform and a service offering that Square could provide...
Why should I care?
It’s a great question. It all comes back to that 30,000 number mentioned at the beginning of this article. That is how many new CPG products are launched each year. That’s enough to fill a Whole Foods a few times over. As you can see, to be a successful brand, you have to have these platforms. If not one, maybe all of them. And they cost a pretty penny. Satori costs on average $80,000/year. Their minimum package is $25,000/year. And the real kicker in all this is that these platforms absolutely stink to use. Brands do not enjoy it.
Where are these platforms lacking:
No visualization: While the data is there, the business intelligence data visualization is pretty poor. A key need is for actual shelf visualization and store placement so you can see where in the store your product is and have benchmarks to compare it to i.e. when Sunny D was on the third shelf to the left it sold X with is Y more than Caprisun in the same month.
No notifications: You can easily be poorly priced on the shelf. A competitor can cut their prices without you knowing. There should be automated trigger notifications so you can understand where you stand.
No automated reporting: Reporting is done quarterly and manually by your customer support person. Should be automated and integrated with a CRM so key stakeholders receive regularly.
No contact information: As mentioned earlier, it is often up to the brand to hustle their way into new stores and expand their footprint to other geos. They can look at each location within these platforms, but the next step is actually getting in touch with the store managers to make a change.
No forecast inputs: Impossible to forecast and plan for your supply chain. Would be ideal to be able to determine in the platform based on past sales and competitive landscape.
The Whole Foods dilemma: Paying per retailer. If you want to get into another Whole Foods, you have to buy the reports from your competitors. It’s an expensive and painful process.
So my three points are this:
There is a market opportunity for a competitor to take on these dinosaur companies. This is a highly disruptable area.
There is an opportunity for a POS company to aggregate enough market share and build their own platform.
In the meantime, taking over a category is not easy. I saw this happen first hand with Yotpo and Trustpilot. It takes years. So, in the meantime if you are an equities trader, I might suggest watching $NLSN.


